
Skip to content
EN ⌄
Discuss your project ↗

Read an ethanol production report before comparing yield and energy

Finished-product volume, work-in-progress inventory and meter boundaries can describe different quantities. A reliable daily report makes the accounting basis explicit before a yield or energy figure is compared.

· Updated ·

Read an ethanol production report before comparing yield and energy

CNE project photography

01 /

Separate the quantities being measured

Record corn received, corn fed through each weighing point, finished alcohol sent to storage, alcohol held in process and product transferred between tanks. Give each value a time interval and unit. A kilolitre of hydrous product is not a tonne of ethanol, and neither automatically equals a kilolitre of absolute alcohol. Product concentration, reference temperature and density are needed for any conversion.

Use the same cut-off time for production and utility readings. Identify values that are measured, estimated, copied from a totalizer or calculated from tank levels. Missing readings should remain missing rather than becoming zero consumption.

02 /

Use a consistent production denominator

Calculate specific consumption using the agreed quantity of conforming product over the same reporting period. Show adjustments for work-in-progress inventory and product transfers separately. Do not mix daily and cumulative figures.

For example, 300 tonnes of raw material divided by 100 tonnes of conforming product equals 3 tonnes per tonne of product. This arithmetic example illustrates the calculation method; it is not a production guarantee.

03 /

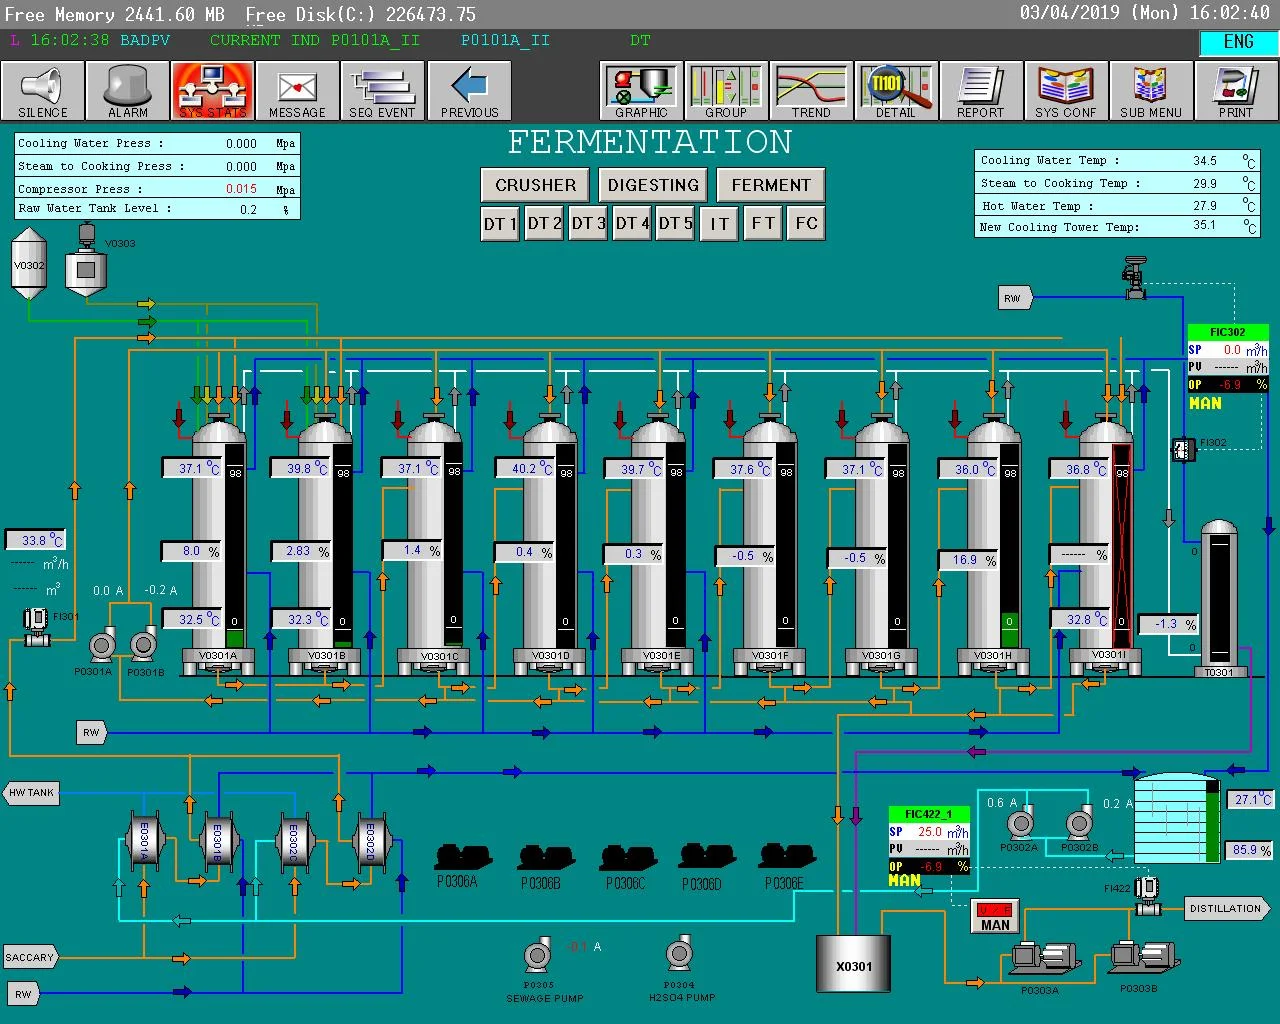
Record operating conditions beside the indicators

Identify measured values, estimates and unavailable readings. Record operating hours, product grade, inventory changes and meter calibration status alongside the calculated indicators. A clear daily dashboard helps the production team understand trends and compare like-for-like operating periods.

04 /

Close the evidence chain before acceptance

Keep the source readings, tank conversion tables, calibration records, laboratory methods and calculation spreadsheet for the same test period. Reconcile opening inventory plus inputs against closing inventory, products, by-products and identified losses. Explain any remaining discrepancy.

Only then compare a measured result against a guarantee with matching feedstock quality, product purity, utility scope and operating duration. Design values, a daily operating record and a signed performance acceptance report answer different questions. This guide concerns data interpretation; it does not establish compliance or acceptance for an individual plant.

Updated · 2026-10-11

Your next plant starts with the right conversation.

Share your feedstock, target product and capacity. Let’s shape a practical process concept.

Discuss your project ↗
滚动至顶部